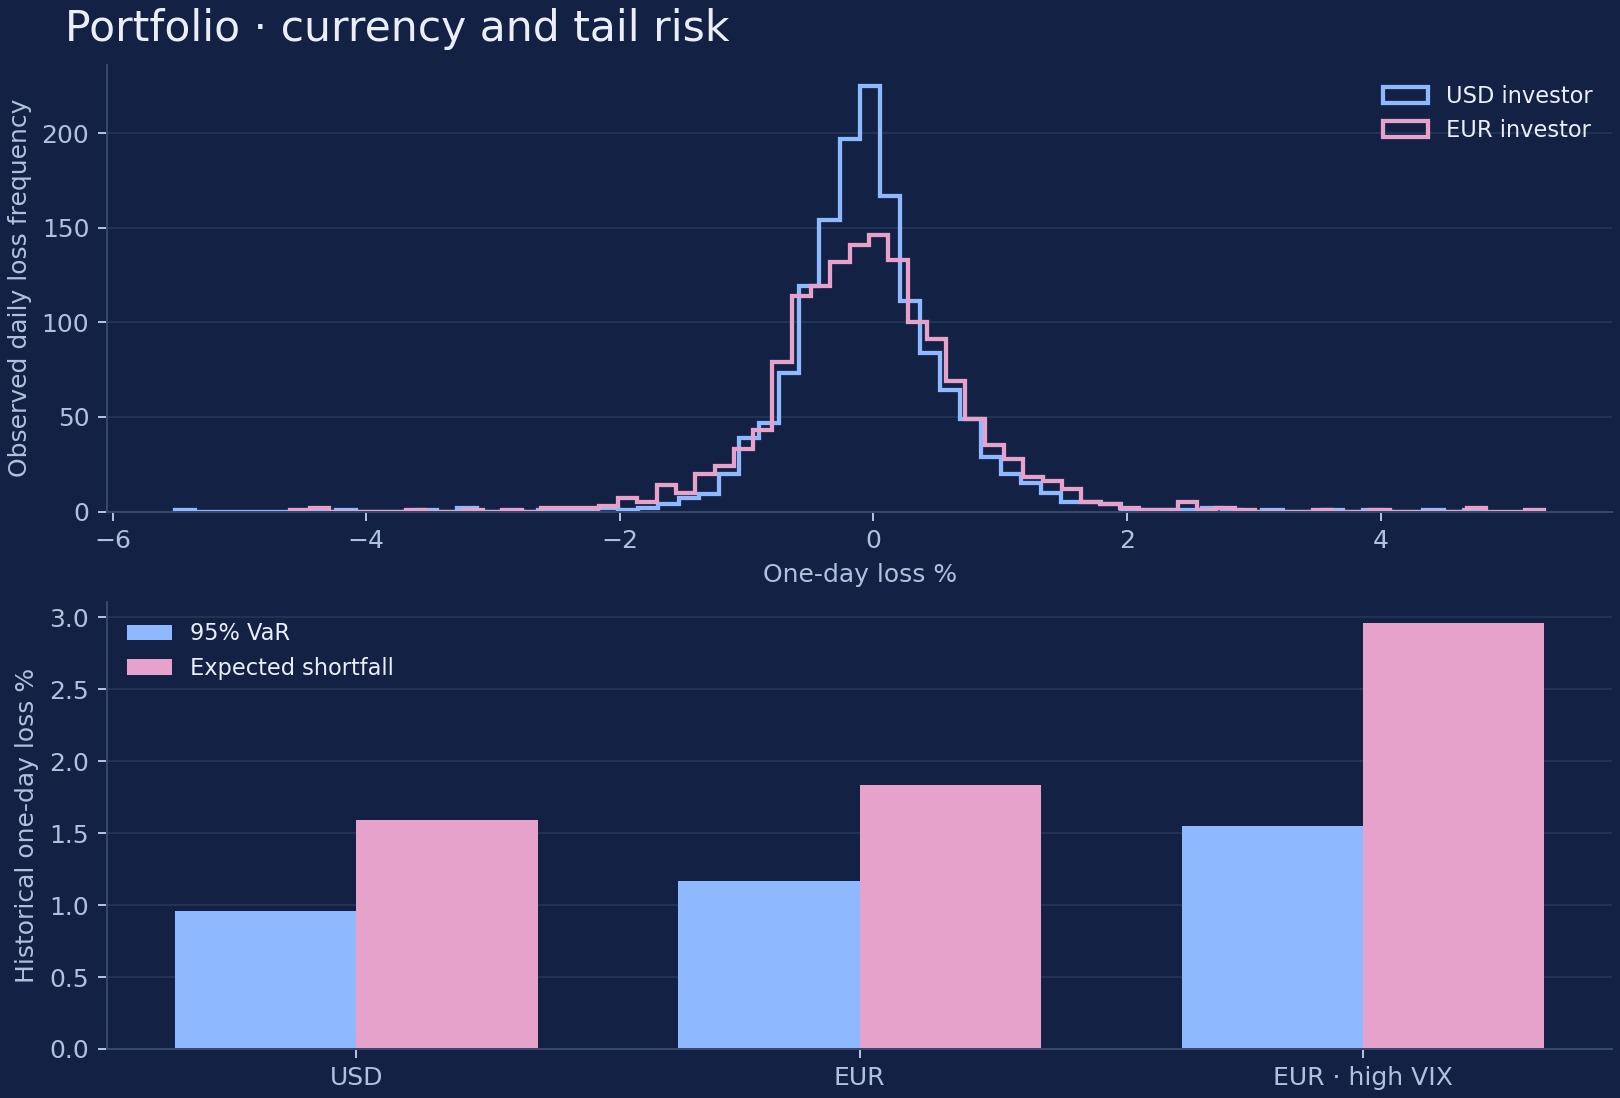
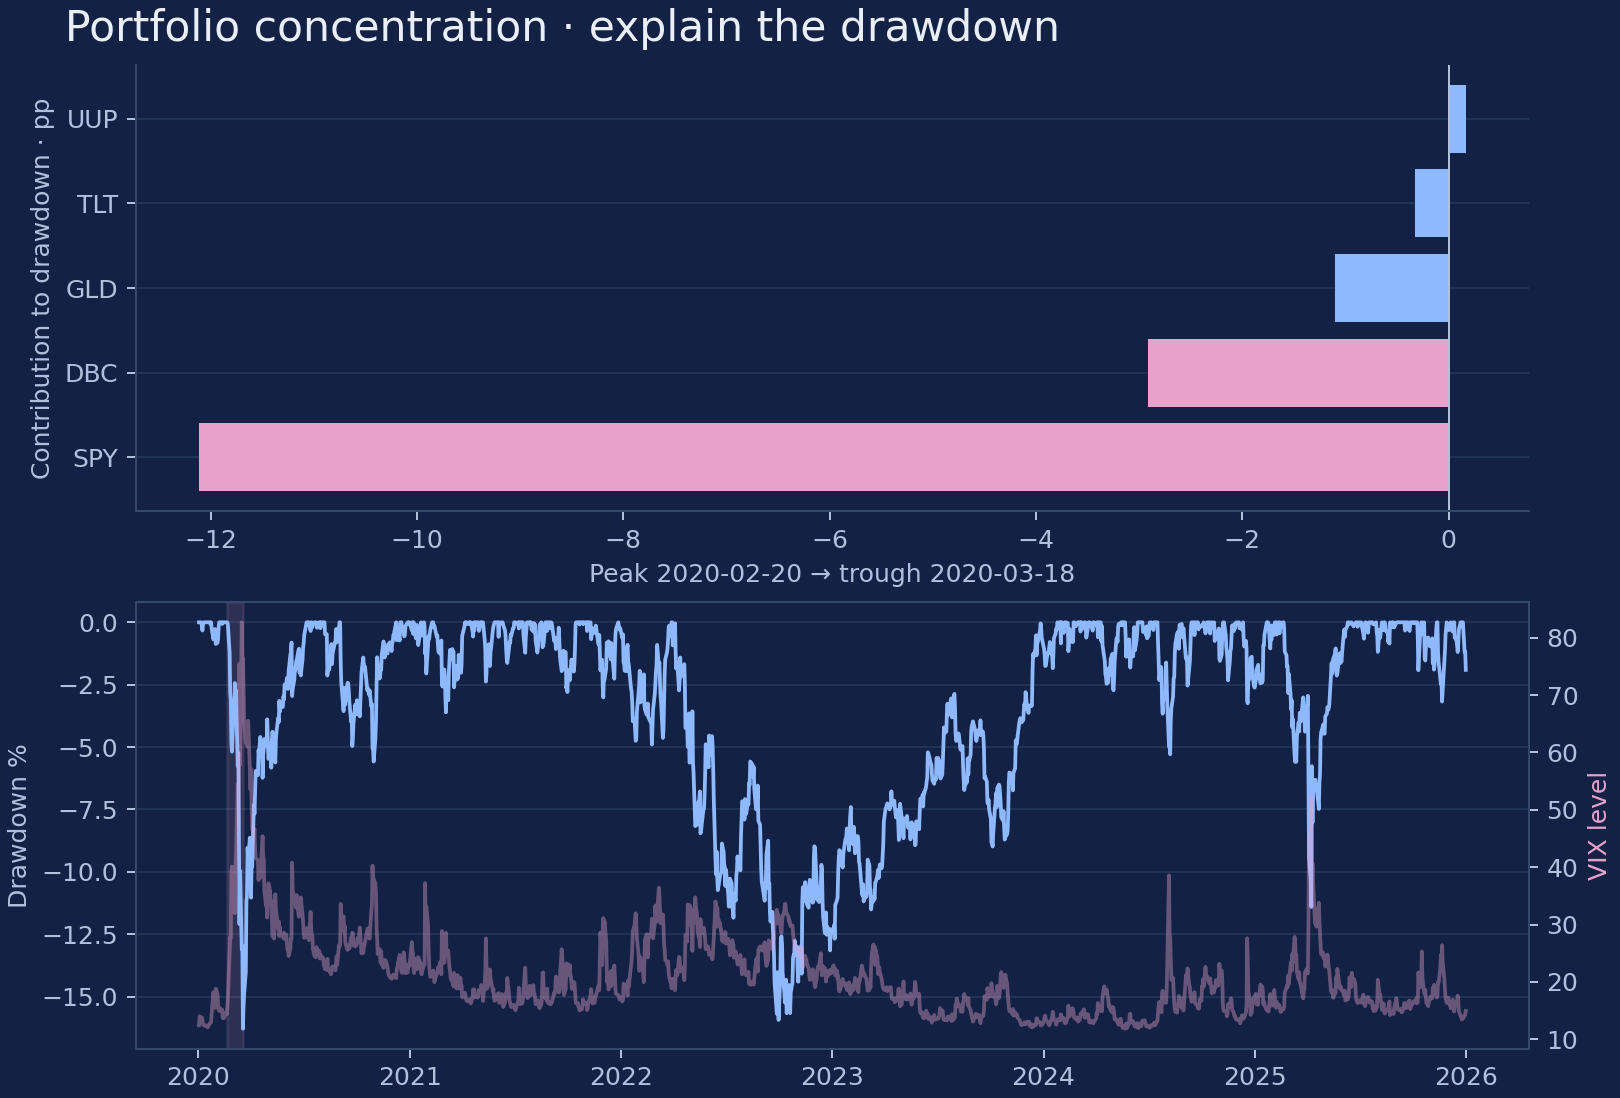
How does FX change your portfolio’s tail risk?
Translate a multi-asset allocation into EUR, estimate historical VaR and Expected Shortfall, and inspect high-VIX observations.
Domain routes · /d/ + provider methodsEOD + ECB + Cboe VIX via FRED
from quantjourney.sdk import QuantJourneyAPI
from sdk_portfolio_var import analyze

qj = QuantJourneyAPI.from_env()
raw = {
    'prices': qj.domains.call('equity.pricing.get_historical_prices',
        provider='eod', symbols=['SPY', 'TLT', 'GLD', 'DBC', 'UUP'], start_date='2020-01-01', end_date='2025-12-31', frequency='1d'),
    'ecb_fx': qj.domains.call('macro.eu.get_ecb_series',
        provider='ecb', series_id='EXR.D.USD.EUR.SP00.A', start_date='2020-01-01', end_date='2025-12-31'),
    'vix_history': qj.domains.call('macro.indicators.get_fred_data_series_by_id',
        provider='fred', search_id='VIXCLS', start='2020-01-01', end='2025-12-31'),
}
result, figure = analyze(raw)
print(result.head())
figure.show()
The preview imports the analysis helper from the full Python file below.
Open the full notebookAdapted from this notebook. The downloadable code produces this analysis.
Calculated from observed API data01 / 29